Harmonic Motion: Spring and Mass
IMANI AND ANNIE
|
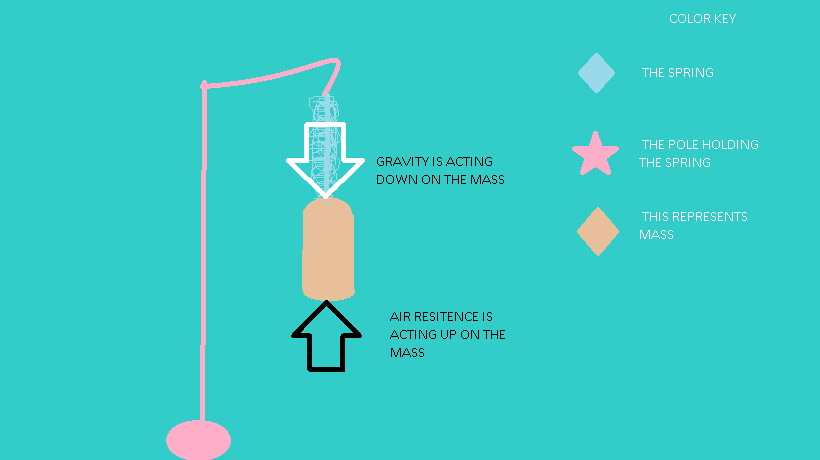
SUMMARYIn this lab, a 500g Mass was hung on on the end of a spring. Someone then proceeded to pull the mass one time, and let it bounce up and down until it came to a stop on its own. In the beginning, the mass was in constant motion and was bouncing at the same speed but after a while, the mass gradually slowed down until it came to a stop. |
~Kinematics~
Position vs Time graph

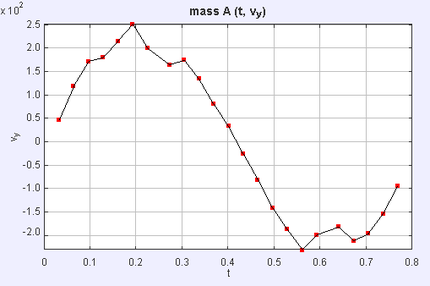
Velocity vs Time graph

Acceleration vs Time graph
|
What is a Spring Constant?
The spring constant is the measure of elasticity and stiffness of a spring. |
Spring Constant Equation
K= (4π²m)/T² K= (4xπ²x0.5 kilograms)/(0.80)² seconds K= 19.7 kilograms/ 0.64 seconds² K=30.8 N/M |
****FORCES****
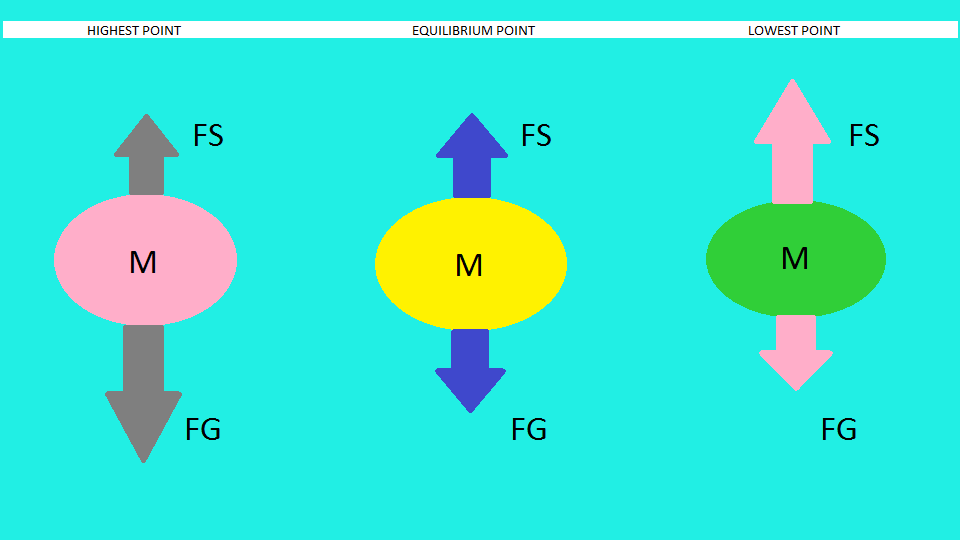
This is my free body diagram. Each of the three models shows three different points that occurred during the mass while in movement: The highest point, the middle point or state of equilibrium, and the lowest point. At the highest point, gravity (FG) is exerting more force the mass than the spring. At the state of equilibrium, the forces are balanced on each side. At the bottom, the spring force is putting more force on the mass than gravity.
EQUATIONS
Highest Point
F = ma
Fs - Fg = ma
Fs - (9.8m/s^2) (0.5kg) = (0.5kg)(-1.75m/s^2)
Fs - 4.9 = -0.875
Fs = 4.025
Equilibrium Point
F = ma
Fs - Fg = ma
Fs - (9.8m/s^2) (0.5kg) = (0.5kg)(0)
Fs - 4.9 = 0
Fs = 4.9N
Lowest Point
F = ma
Fs-Fg = ma
Fs - (9.8m/s^2) (0.5kg) = (0.5kg)(2.0m/s^2)
Fs - 4.9 = 1.0
Fs= 5.9N
Forces vs time
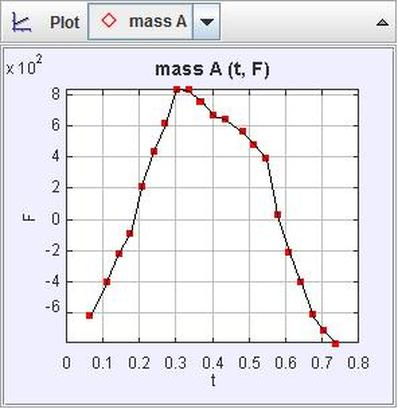
This graph illustrates the forces acting on the mass during one interval. As you can see, the forces are not constant and continued to change. From the beginning the forces increased and stated the same for a little but then decreased.
ENERGY
Kinetic energy vs time

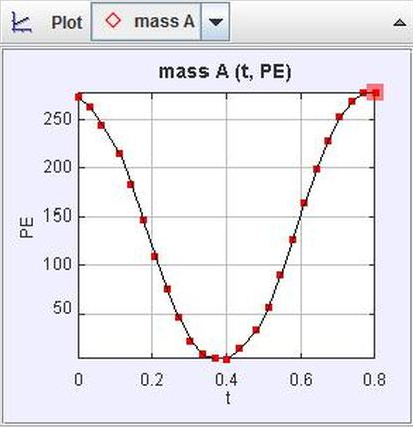
POTENTIAL ENERGY VS TIME
tOTAL MECHANIC ENERGY

tOTAL VIDEO'S KINETIC ENERGY
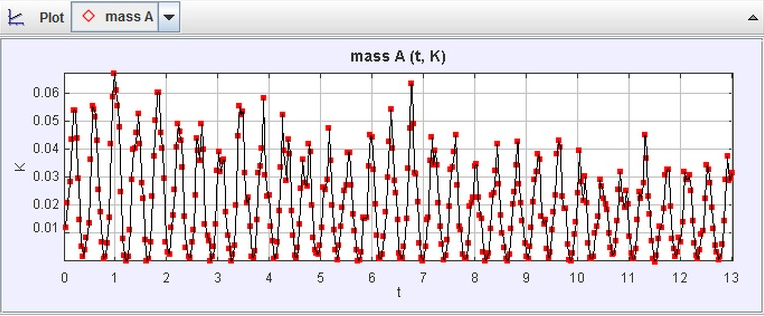
This graph shows the kinetic energy over the whole video. It was not constant and continuously increased and decreased.
